.png)

You've just launched a new service and your sales team is eager to start outbound calling campaigns. But there's a problem: with no historical data, you have zero conversion rate benchmarks to measure against. On top of that, you're dealing with variables you can't control, like fluctuating staff capacity and messy data quality. How can you possibly test different sales strategies across multiple segments without drawing inaccurate conclusions?
This is the data scientist's equivalent of flying blind. But fortunately, you don't need pre-existing baseline data to run effective A/B tests that yield actionable insights.
Why A/B Test When You're Flying Blind?
Even without historical data, A/B testing is crucial for moving away from intuition-based sales strategies. Rather than focusing on hitting specific benchmarks, your goal shifts to identifying the better-performing strategy through systematic comparison.
The beauty of starting from scratch is that your initial test results become the foundation for all future optimization. You're not just testing strategies—you're building your baseline data from the ground up.
The No-Baseline Playbook: Embracing Quasi-Experimental Design
When true randomized experiments aren't possible—a common reality in real-world sales environments—Quasi-Experimental Design becomes your best friend.
Quasi-Experimental Design is a research methodology for studying cause-and-effect when full experimental control isn't practical. Unlike traditional experiments, quasi-experiments work with pre-existing groups or when random assignment isn't feasible—perfect for sales teams with varying capacities and data quality issues.
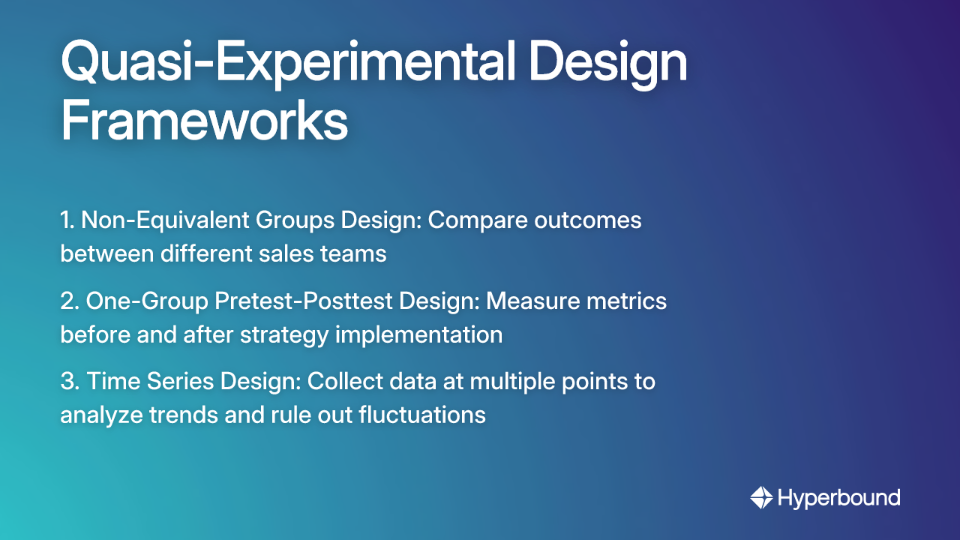
Here are three practical frameworks you can implement:
- Non-Equivalent Groups Design: Compare outcomes between different groups that weren't formed through random assignment. For example, one sales team applies Strategy A while another uses Strategy B.
- One-Group Pretest-Posttest Design: Measure key metrics before implementing a new strategy, then measure the same metrics after. This approach is useful when you need to maintain a single, consistent sales approach.
- Time Series Design: An extension of the pretest-posttest design where data is collected at multiple points before and after a change to analyze trends and rule out temporary fluctuations.
Setting Up Your Test: Control Groups and Randomization
The cornerstone of any A/B test is a well-designed control group—a segment of your audience that doesn't receive the new sales strategy. This group serves as your anchor for comparison, allowing you to see what would have happened without the change.
Before creating groups, clearly define your objectives. Are you trying to improve call-to-demo conversion rates? Increase the number of follow-up conversations? Boost overall sales?
Once your objectives are clear, use these methods to create groups:
Random Assignment Methods
- Simple Random Sampling: Randomly select prospects from your total available audience to participate in either the control or test group. This is the gold standard for eliminating bias and should be your default approach when possible.
- Stratified Sampling: If your prospect list contains distinct characteristics (e.g., high-LTV prospects vs. low-LTV), stratify your sample to ensure each subgroup is proportionally represented in both the control and test groups. This is particularly useful when working with "impactable healthcare spend" or other segmentation criteria.
Establishing Meaningful Metrics from Scratch
Without baseline data, focus on metrics that are directly tied to sales activities and can be compared relatively between your test and control groups:
Key Performance Indicators (KPIs) to Track:
- Engagement Metrics:
- Response rates to outreach (email replies, returned calls)
- Call duration (as a proxy for prospect interest)
- Number of follow-up calls accepted
- Funnel Progression Metrics:
- Conversion rate from initial contact to a scheduled meeting/demo
- Conversion rate from demo to proposal
- Conversion rate from proposal to closed sale

- Revenue Metrics:
- Revenue generated per outreach method
- Average deal size
- Estimated LTV of converted prospects
Speaking of LTV (Lifetime Value), this can be particularly challenging for new services. When direct LTV is unknown, use proxies like "impactable healthcare spend" or known KPIs from similar customer segments in your existing products. Alternatively, focus on short-term, measurable conversion goals first—LTV models for new services are often speculative and can add noise to your A/B test results.
Practical Framework: Testing Calling Strategies
Let's apply these concepts to a real-world scenario: testing "calling as many prospects as possible" versus "prioritizing follow-up calls."
Step-by-Step Implementation:
- Define Groups:
- Group A (Control/Strategy 1): Sales reps make first-time calls to as many new prospects as possible from their assigned list.
- Group B (Test/Strategy 2): Sales reps prioritize follow-up calls with prospects they've already contacted, over making new first-time calls.
- Assign Prospects: Randomly assign your list of prospects to Group A and Group B to ensure the lead quality is balanced.
- To ensure the test is valid, both groups must execute their assigned strategies consistently. This is where practice becomes critical. Before going live, allow reps to master their approach using AI sales roleplays. This controlled environment ensures that you're truly testing the strategy, not just variations in individual rep performance.
- Set a Timeframe: Run the test for 2-4 weeks to collect sufficient data and average out daily fluctuations.
- Track Metrics: For both groups, meticulously track:
- Number of calls made
- Number of conversations held
- Number of demos/meetings booked (your primary conversion metric)
- Number of closed deals (if the sales cycle is short enough)
- Analyze Results: After the test period, compare the conversion rate (meetings booked per prospect or per call) between Group A and Group B to determine which strategy is more effective.
Handling the Uncontrollable: Staff, Data, and Market Noise
Real-world sales environments come with variables you can't control. Here's how to mitigate their impact:
Staff Capacity Issues:
- Set realistic limits on testing based on available resources
- Don't run too many tests at once
- Document any changes in staffing during the test period as annotations in your analysis
Data Quality Problems:
- Conduct a pre-test data assessment
- Implement data cleaning and validation processes before launching the test
- Regularly clean and maintain your data throughout the process
Minimizing Bias:
- Use statistical controls and matching techniques
- Ensure the treatment and control groups are as comparable as possible on known variables like company size, industry, or estimated LTV
Ensuring Statistical Rigor Without a Baseline
Even without baseline data, maintaining statistical validity is critical:
Key Statistical Concepts:
- Confidence Level: The probability that you won't make a Type I error (false positive), commonly set at 95%.
- Statistical Power: The probability of detecting an effect if there is one, aiming for at least 80%.
- Minimum Detectable Effect (MDE): The smallest effect size you want to identify. Start with a practical goal: "What is the smallest lift in conversion that would make this strategy change worthwhile?"
Common Pitfalls to Avoid:
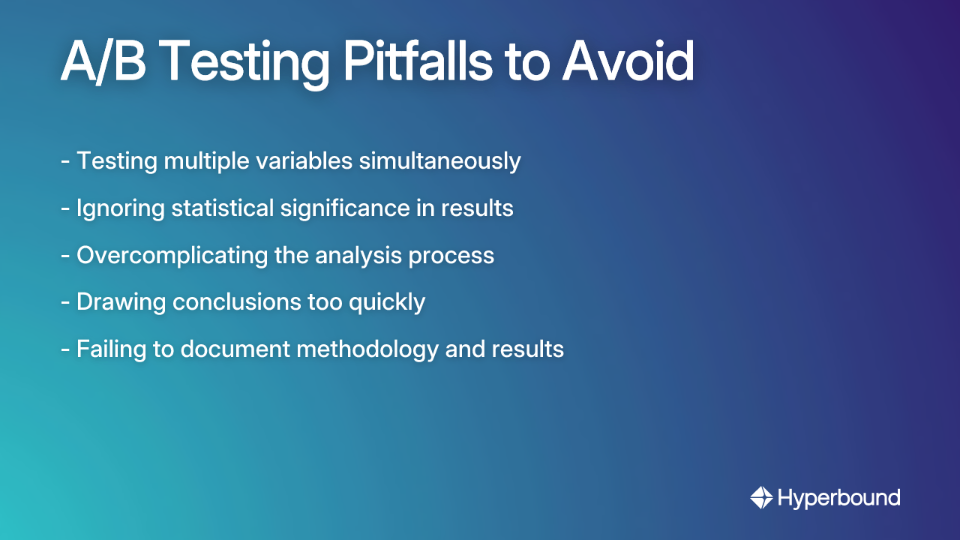
- Testing Multiple Variables: Change only one element at a time to accurately determine what caused the performance change.
- Ignoring Statistical Significance: Don't declare a winner based on a small difference. Use significance testing to confirm your results.
- Overcomplicating the Analysis: Start simple and focus on clear, actionable insights rather than perfect statistical models.
From Guesswork to a Growth Engine
A/B testing without baseline data is not only possible but essential for new initiatives. By focusing on relative lift rather than absolute performance, using concurrent control groups as your comparison, and maintaining statistical rigor, you can transform your outbound sales approach from guesswork into a data-driven growth engine.
Start small—pick one clear hypothesis (like the follow-up vs. new prospect test), set up the experiment diligently, and use the results as the first building block for a data-driven sales culture.
And remember: Document Everything. Keep thorough records of your tests, hypotheses, and outcomes. This documentation will become your invaluable baseline for all future optimization efforts.
Frequently Asked Questions
What is A/B testing in sales without baseline data?
A/B testing in sales without baseline data is a method of comparing two different strategies (Strategy A vs. Strategy B) to see which one performs better, even when you have no historical performance metrics. Instead of measuring against a pre-existing benchmark, you focus on the relative lift or difference in performance between the two strategies being tested simultaneously.
Why is A/B testing important for a new product launch?
A/B testing is crucial for a new product because it helps you move from intuition-based decisions to data-driven strategies right from the start. It allows you to systematically identify the more effective sales approach for a new market or service, and the results from your initial tests become the foundational data for all future optimization efforts.
How can I run an A/B test if I can't create truly random groups?
You can run an effective A/B test using Quasi-Experimental Designs when true randomization isn't possible. This approach uses methodologies like the Non-Equivalent Groups Design, where you compare outcomes between pre-existing groups (like two different sales teams), or a Time Series Design, where you collect data at multiple points before and after a change to analyze trends.
What are the most important metrics to track in a sales A/B test with no history?
The most important metrics to track are those directly tied to sales activities and can be compared relatively between your test and control groups. Key metrics include engagement rates (e.g., call response rates, call duration), funnel progression metrics (e.g., conversion rate from contact to demo), and revenue proxies (e.g., average deal size or impactable spend).
How long should you run a sales A/B test?
A sales A/B test should typically run for 2-4 weeks. This timeframe is usually long enough to collect sufficient data to achieve statistical significance and average out any daily or weekly fluctuations, but short enough to provide timely, actionable insights.
What is a common mistake to avoid when A/B testing sales strategies?
A common mistake is testing too many variables at once. To get clear and accurate results, you should only change one element at a time between your control and test groups. This ensures that you can confidently attribute any difference in performance to the specific change you made.
How do you measure success without a conversion benchmark?
Success is measured by identifying the better-performing strategy through direct comparison, not by hitting a specific target. The group that shows a statistically significant improvement in your chosen KPIs (like a higher demo booking rate) is the winner. This "winning" strategy's performance then becomes your new benchmark for future tests.

Book a demo with Hyperbound


